Purpose
Once the simulation is complete, the software enters post-processing mode to allow for visual and analytical inspection of the data. This section explains how to access, visualize, and manage the output files generated by SIMOULDING.
1. Output Files Directory
All simulation results are stored in the project folder. Understanding these extensions is vital for technical data management:
| File Extension | Description |
|---|---|
| (name).log | Central control file. Contains the simulation summary, pre-process alerts, process warnings (e.g., adhesion issues), Max/Min values, and the PIAT. |
| (name).post.res | Contains the physical mapping results (thicknesses, temperatures, etc.) on the mesh. |
| (name).post.msh | The specific surface mesh where mapping results are projected and visualized. |
| (name).grf | Numerical data for XY graphs (Monitoring points and general process data). |
| (name) view in position.msh | Displays the actual mould position in the machine as defined in the Mould Position section. |
2. Access and Process Warnings
Post-processing can be accessed via the toolbar icon or directly from the button in the simulation completion pop-up.
3. Mapping Tools (View Results)
The View results menu provides several tools for geometry-based analysis:
- Contour Fill / Contour Lines: Color mapping and level lines to visualize result distribution.
- Show Min / Max: Automatically locates extreme values on the geometry.
- Result Surfaces: Segregates the geometry into surfaces according to value ranges for an overall magnitude assessment.
- Contour Fill Range Under Cursor: A dynamic tool that shows the exact value at the pointer's location in the status bar.
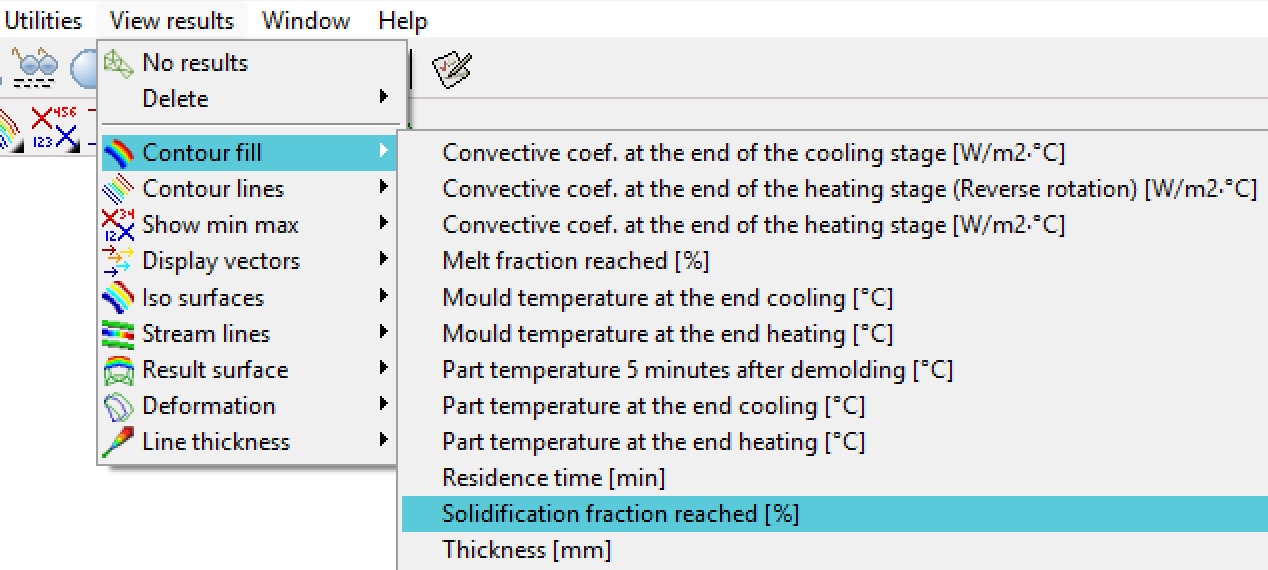 Figure 1: View Results menu and visualization tools.
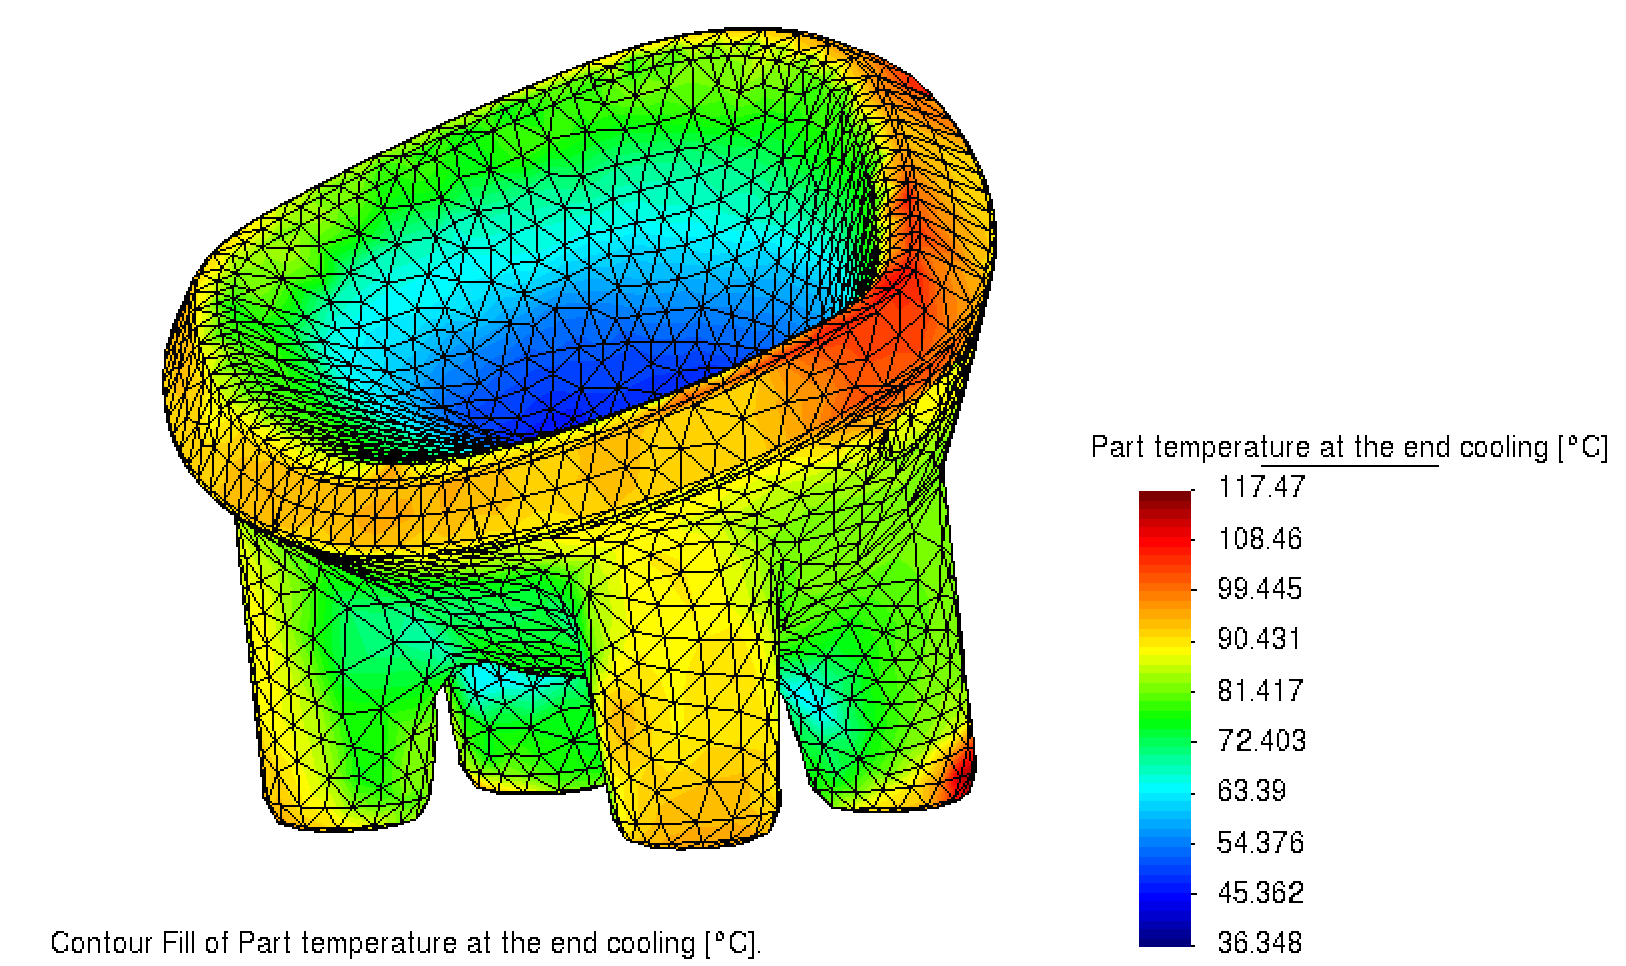 Figure 2: Example of thickness distribution mapped onto the geometry.
4. XY Graphs Window
This window allows for the analysis of two types of time-based data:
Monitoring Points
Specific evolution at the points defined by the user in the Monitoring Points section (Section 2.5.6).
General Process Data
A comprehensive graph comparing all cycle variables vs. time:
- Oven: Setpoint temperature vs. actual oven air temperature.
- Internal Air: Temperature evolution of the air inside the mould.
- Mould: External surface vs. internal surface temperature.
- Material: Average polymer powder temperature and the Remaining Powder Curve (visualizes material consumption as it adheres).
- Physics: Internal pressure and convective coefficient of the air around the mould.
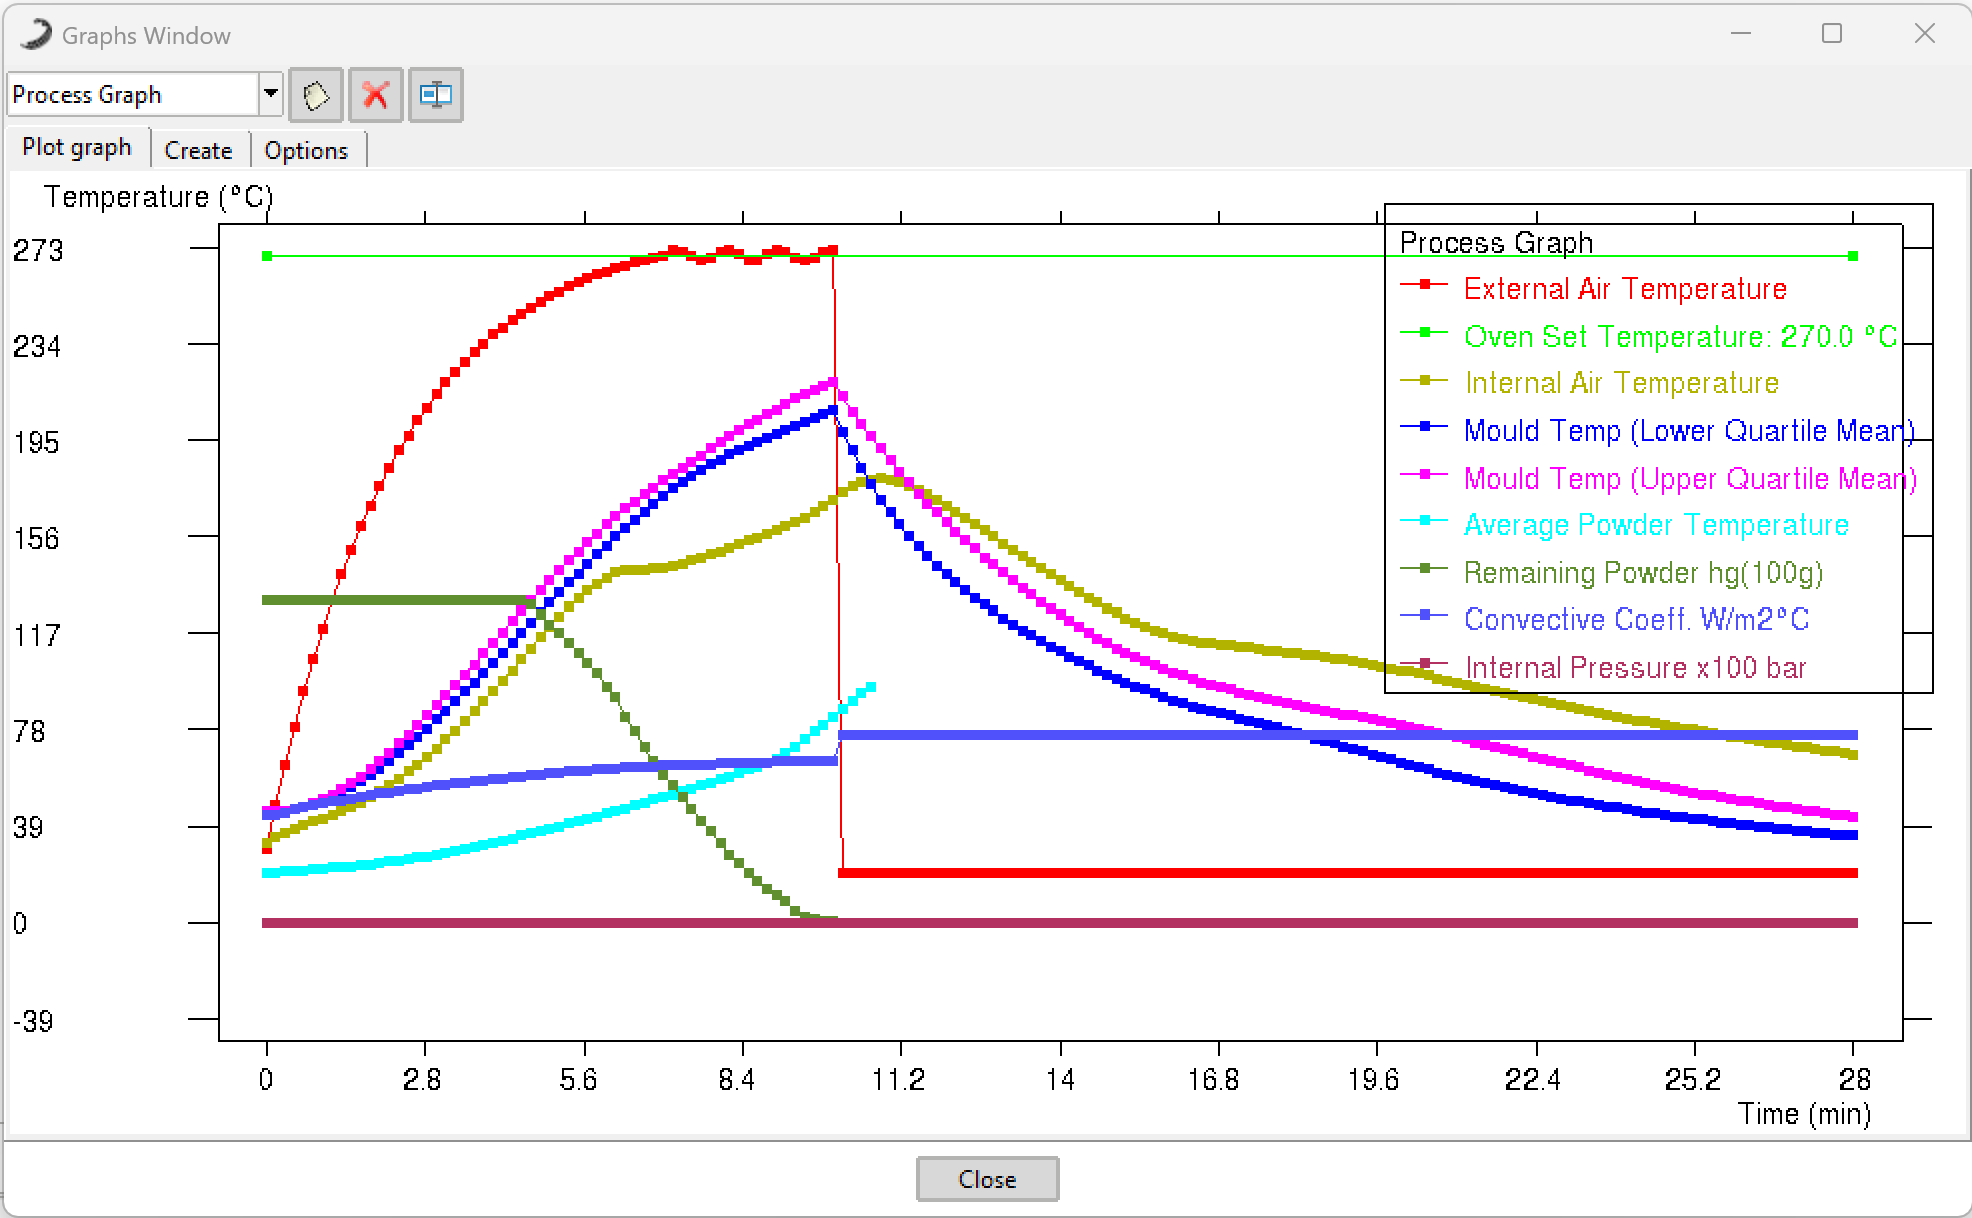 Figure 3: Example of XY graph displaying process variables and monitoring point evolution over time.
5. Data Export
Both the mapping results (distributions) and the XY graph curves can be exported to various standard formats for external reporting and further technical analysis.