Purpose
This function provides the ability to perform an exhaustive tracking of thermal and physical evolution at specific points of the geometry. It is the key tool for analyzing material behavior in critical zones, allowing the comparison of results between areas with different conditions (e.g., a zone with nominal thickness vs. a zone with an insert or insulation).
1. Point Configuration
- Interval [min]: Defines the time range (start and end) during which data will be captured.
- Point Names: It is recommended to use names that identify the point's condition to facilitate comparative analysis, such as:
Point_over_insulation,Point_insert_zone, orPoint_nominal_thickness.
2. Selection Methodology
Unlike thermal areas, here the user selects geometric points instead of surfaces:
- Location: As many points as desired can be placed on the mould faces.
- Assignment: Create the group, define the interval, click Assign, and mark the points directly on the 3D model.
3. Results and Graphical Analysis
The data collected at these points is displayed through XY graphs showing the synchronized evolution of the most important process variables:
- Mould temperature: At the exact selected point.
- Internal air temperature: To observe the gradient relative to the mould.
- PIAT (Peak Internal Air Temperature): A fundamental process control point.
- Thickness (Adhered layer): How the thickness growth evolves at that point over time.
- Layer temperature: The thermal evolution of the polymer in contact with the mould.
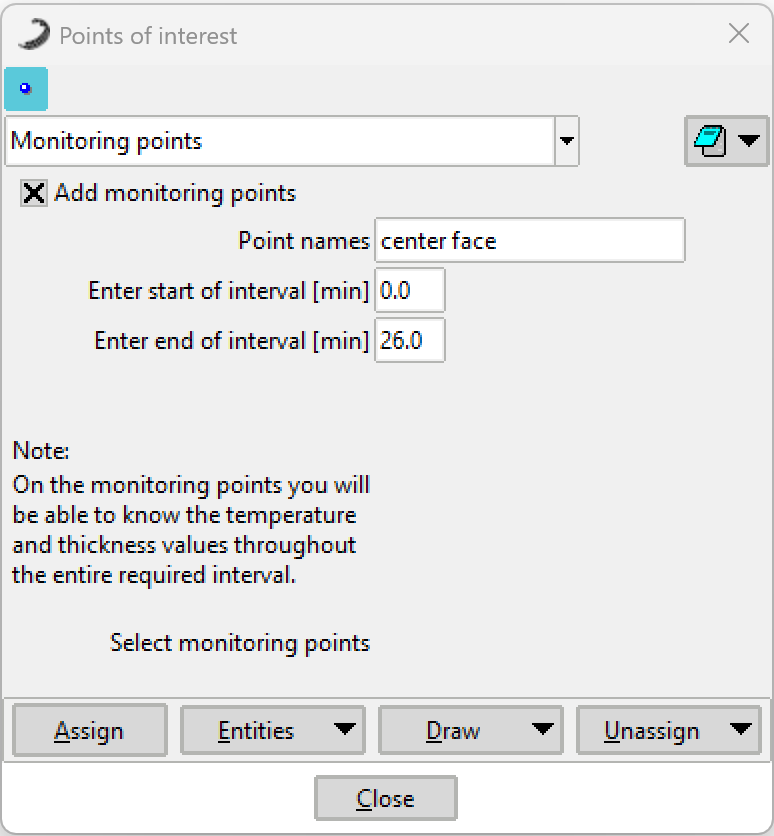 Figure 1: Monitoring Points configuration window.
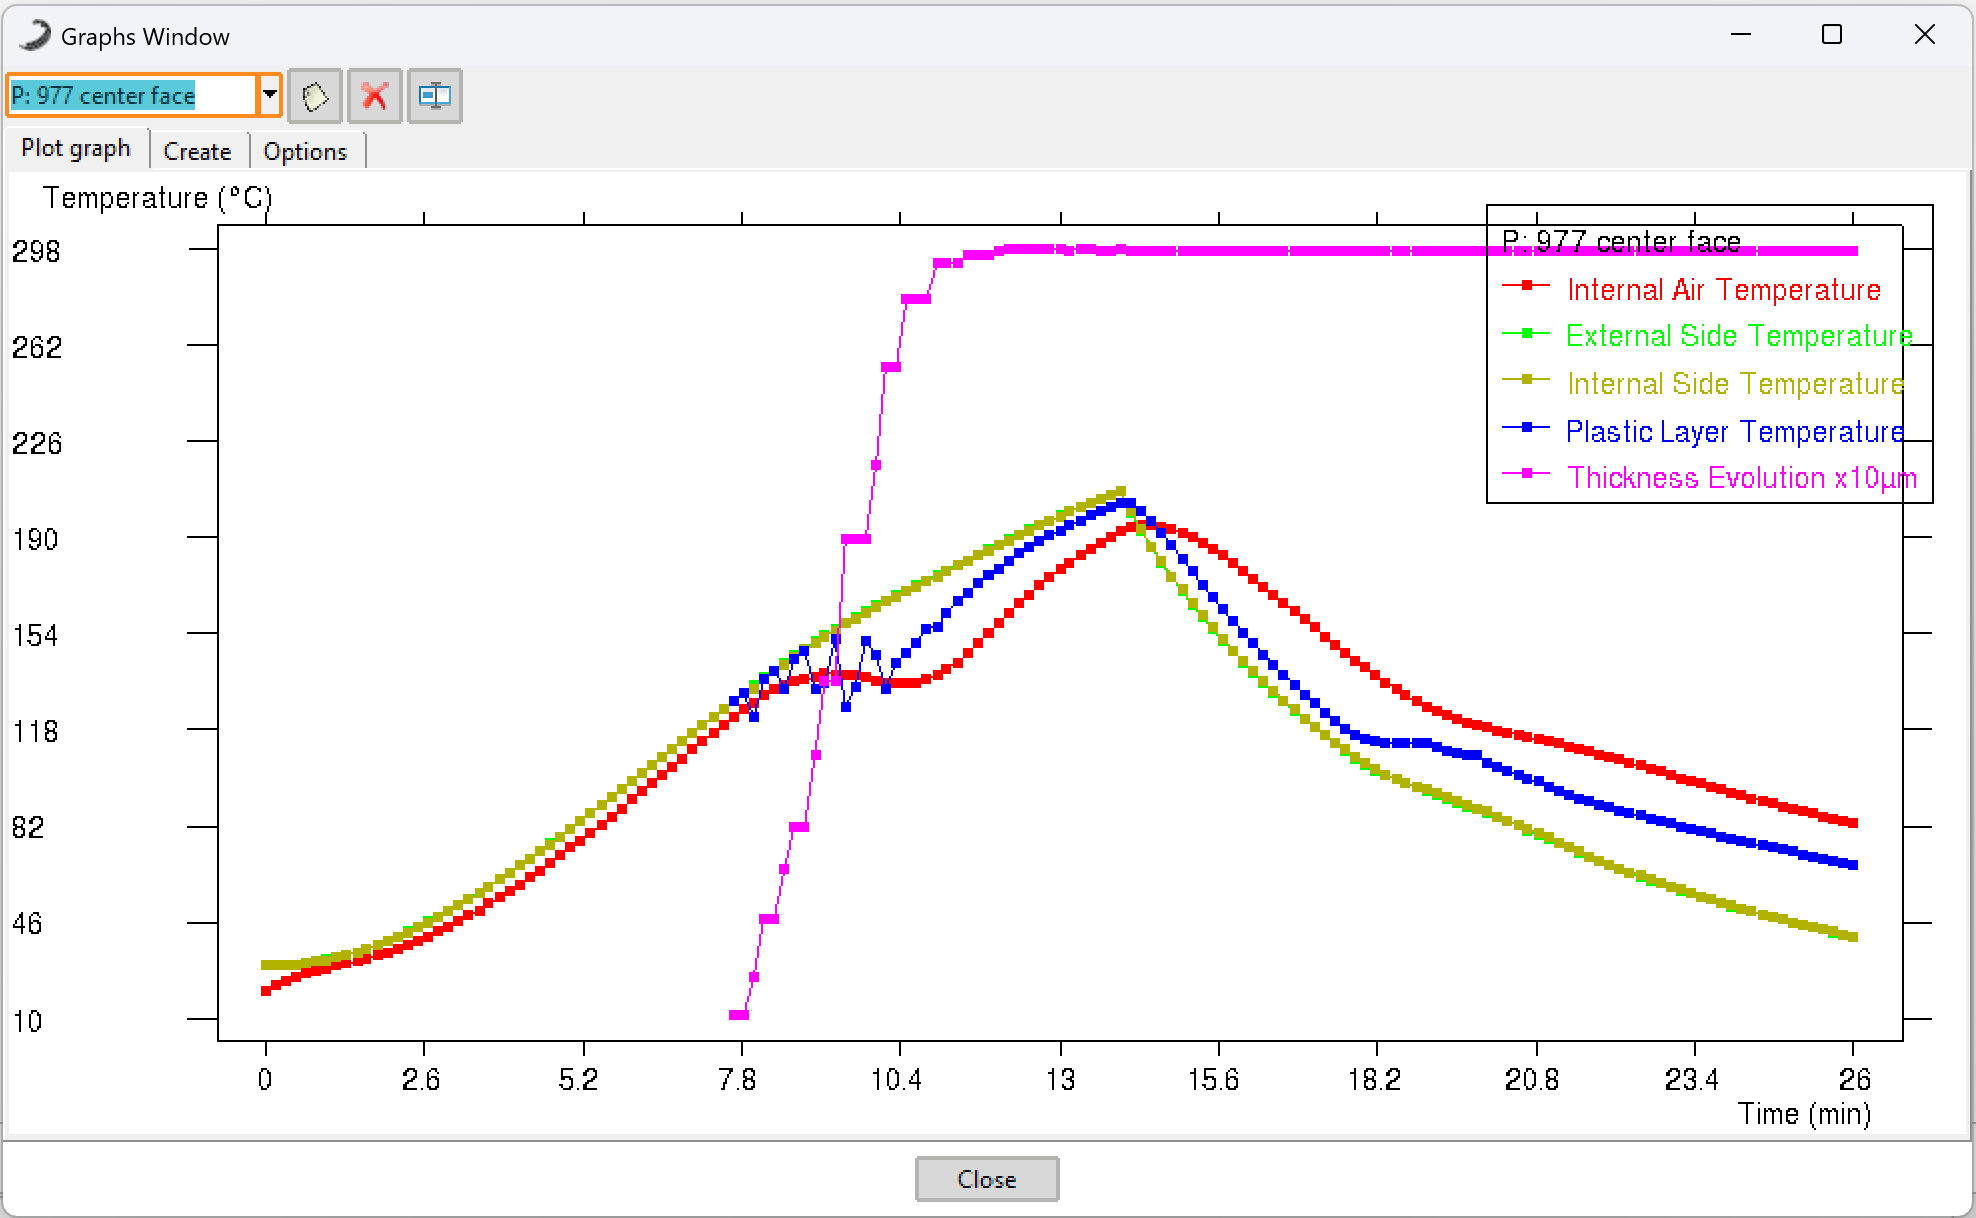 Figure 2: Example of a graph showing the evolution of temperature and thickness at a monitoring point.