1.1. Data Tree Interface and Logic
The Data Tree is the core of the SIMOULDING interface. This tree becomes active as the data necessary for the project is entered. All simulation parameters are directly linked to this geometric model.
Configuring a project in SIMOULDING is equivalent to the setup of a real rotomoulding machine. To ensure a successful simulation, the user must follow the downward order of the Data Tree items, integrating process parameters with mould and part characteristics.
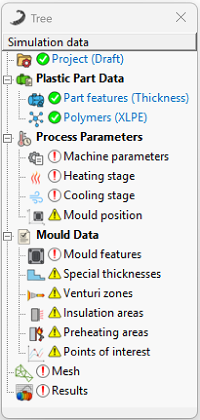
Figure 1: Data Tree structure and its dependency on geometry.
Status Indicators
The definition status of each branch is monitored by visual indicators:
-
 Red exclamation mark: Mandatory parameters missing.
-
 Yellow exclamation mark: Optional parameters (e.g., Venturi, Insulation, or Monitoring Points).
-
 Green checkmark: Section completed.
Critical Note: The green checkmark confirms data entry but does not validate physical consistency.
Green checkmark: Section completed.
Critical Note: The green checkmark confirms data entry but does not validate physical consistency.
Accessing Data Entry
Users can access editing windows through two redundant paths:
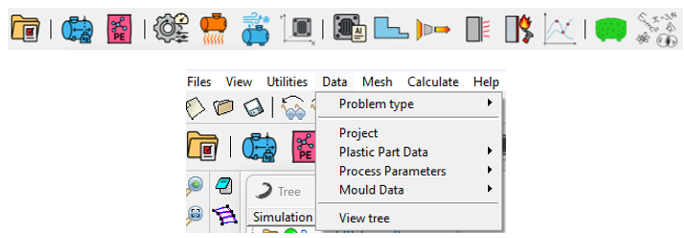
Access via Toolbar (top) or Data Menu (bottom).
1.2. Project Configuration Sequence (Workflow)
For a successful simulation, users must follow this logical workflow:
Load the 3D model (STEP, IGES, etc.) via File -> Import. This is the foundation of the project.
-
 Define Project: Set project name and select output variables.
-
 Plastic Part Data:
- Part Features: Select simulation objective: Thickness (mm) or Shot Weight (kg).
- Polymers: Select material and assign it to the geometry.
-
 Process Parameters: Define machine speeds, thermal cycles, and mould position.
-
 Mould Data: Define mould material, wall thickness, and optional features (e.g., Monitoring Points).
-
 Mesh Generation: Discretize the domain.
-
 Simulate: Start the numerical solver.
1.3. Results Analysis (Post-process)
Once the simulation is complete, the system generates a database for comprehensive analysis:
- Post-process Environment: Switch from "Pre-process" to "Post-process" mode using the toolbar icon.
- Mesh Mapping: Visualize all variables selected in Project Data (e.g., thickness, temperatures, melt fraction) as contour maps directly on the mesh.
- XY Graphs and Process Data: Generate temporal evolution graphs to analyze process variables and specific behavior at the Monitoring Points selected on the geometry.